Take advantage of our special 10% discount for all our blog readers!
We use cookies to improve the services we offer you. By continuing to browse this site, you consent to keep them in accordance with our Privacy Policy.
×
 6,461
6,461
 17 min
 2
2
So you’ve created your YouTube channel, uploaded a dozen videos and got your first subscribers. Now, how can you know if people actually like your content – by views, likes, and comments? Unfortunately, those numbers are not enough to give you an understanding of your audience.
If you’re looking to improve your performance on YouTube, you’ll have to learn how to use YouTube Analytics. It’s a free built-in tool that helps monitor the performance of your channel and provides data on every video. However, data is not helpful if you don’t know how to interpret it and how to adapt your strategy based on what you see.
Our ultimate guide to YouTube Analytics numbers is here to help you! Let’s dive into the amazing world of YouTube Analytics together and uncover new ways to improve your channel. First, we’ll take a look at what data is available to you and how you can get to it in the YouTube Studio. Then we’ll talk about how to interpret the data to better understand your audience and make more engaging videos.
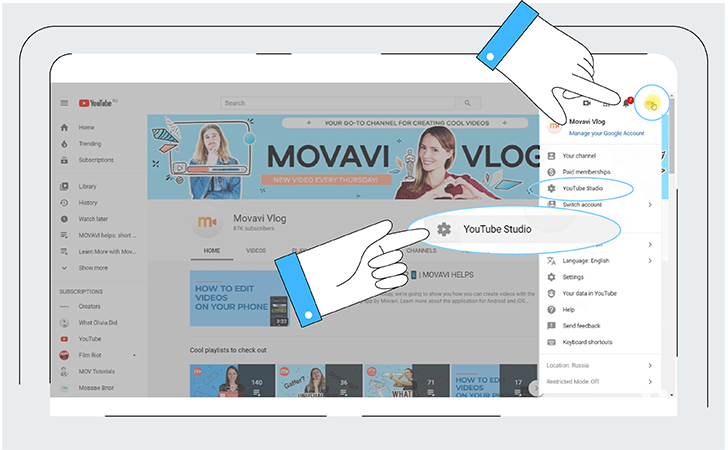
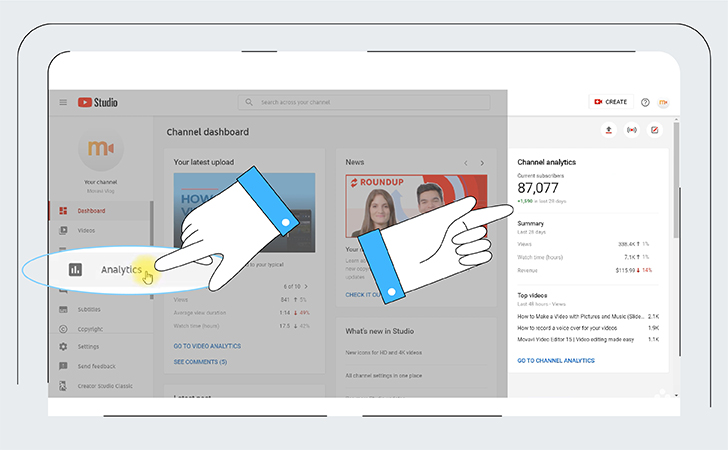
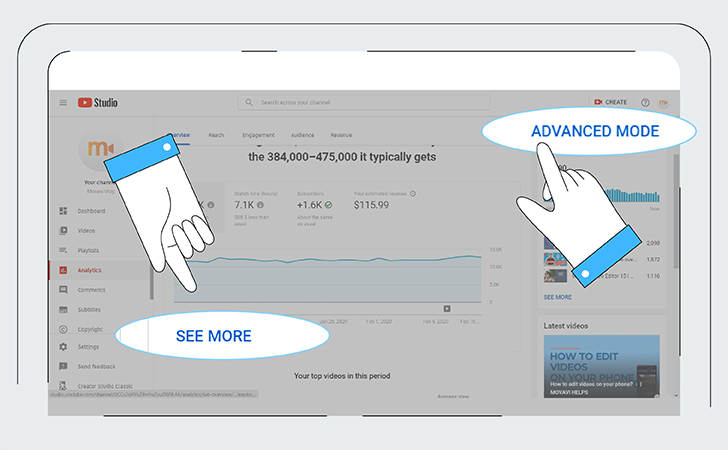
Here’s how you get to YouTube channel analytics. Click on your user image in the top right corner. Go to YouTube Studio and choose the Analytics section from the left-hand menu.
The first thing you’ll see is a 28-day data overview of your content. You can check the stats for the channel in general or for individual videos. To see the stats for a specific video, find it in the Videos menu on the left. If you need to know the numbers for a specific period of time, set the dates in the bar in the upper right corner.
The report has four main tabs: Overview, Reach, Engagement, and Audience. If you’re a member of the YouTube Partner Program, you’ll also see an additional Revenue tab. Let’s see what each of the tabs can give you.
Enjoy our special 10% discount for all blog readers!
Promocode: SUPERBLOG
The Overview tab gives you insights about your channel’s performance. Here you get access to data on views, watch time, subscribers, and (if you’re in the YouTube Partner Program) estimated revenue. In the graph below, you can select any of the metrics and see how each changes day by day. The Play buttons below the graph indicate days when you published a new video – this helps you to compare these metrics against your most recent uploads.
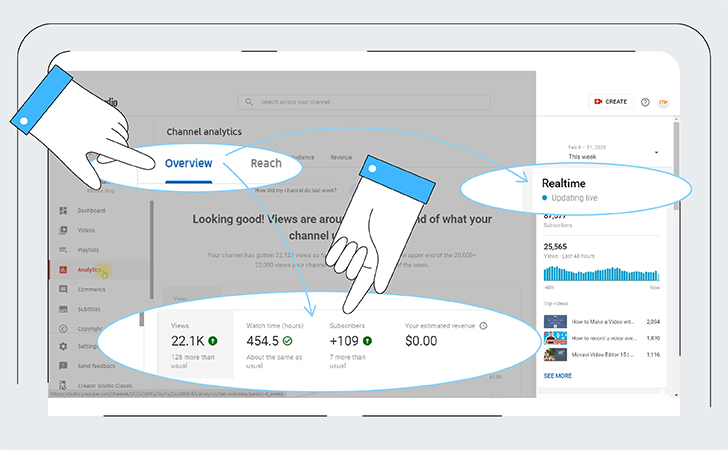
In the same tab, you’ll find real-time activity from the last 48 hours as well as your top videos for the selected period. There’s also a snapshot of the performance of your last 10 videos.
The Reach tab will give you an understanding of how many viewers watch your content and how they find it. This includes impressions, click-through rate, and unique viewers.
Here you can learn about your videos’ traffic sources. The most interesting part of this tab is the viewership funnel. It shows the whole viewership process from serving an impression all the way to how clicks and views lead to watch time.
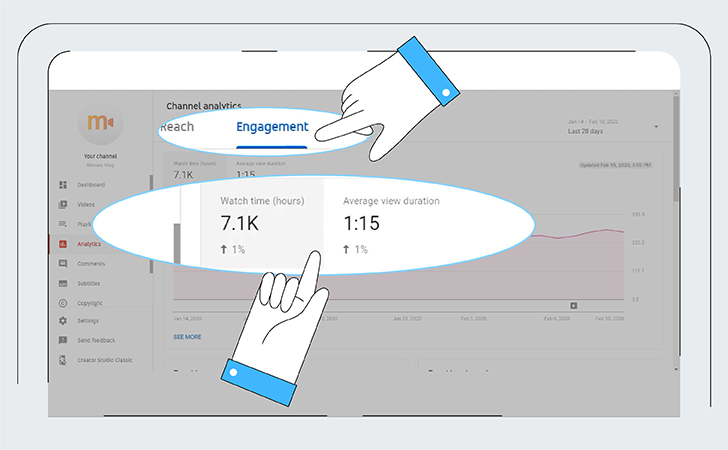
The Engagement tab provides data on audience retention. This includes watch time, average view duration, and end screens. At the individual video level, you’ll find information on likes vs dislikes as well as the end screen click rate (if you’ve included one).
On the Audience tab, you’ll learn more about who’s watching your videos – the number of unique viewers, average views per viewer, and subscribers.
At the channel level, this tab also gives you the bell notification card. It informs you about those subscribers who’ve enabled notifications for your channel or for their YouTube account on their device.
Last but not least, this tab shows you insights about your viewers’ gender, age, and location (country).
If you have a Revenue tab, you will see data on your monthly estimated revenue, your top-earning videos, and breakdown of your revenue sources and top ad types.
By hitting the See more button on any card you’ll get to the Advanced mode of your Analytics, where you can take a deep dive into your stats.
In the search bar in the upper left corner, you can search for the specific video you want to see the stats for. You can also check data for a whole playlist or for a particular group of videos.
Groups let you analyze segments of your content. Create a group with all your vlogs or challenge videos and see the trends related to that exact type of content. You can see what performs better on your channel – educational or entertaining content, short or longer videos, and more.
To create a group, click on your channel name, go to the Groups section, and press Create new group. All created groups are automatically saved – you’ll see the list below the search bar.
Advanced analytics mode lets you sort data in many ways.
In the top row of the report, there are options to break down your data in many ways: Traffic source, Geography, Viewer age, Subscription status, and more. In each part of the report, there are lots of different metrics. To add metrics to your report, tap on the drop-down menu in the upper left corner of the report, and choose the desired metrics.
All the metrics you choose will appear in the chart. You can hover over any part of the chart for more details. The table below the chart gives you a further breakdown of your data. You can check the boxes next to individual rows in the table to change what you see in the chart.
By clicking on any row, you’ll get more detailed data. Let’s say you’re viewing traffic sources. You can check what searches led to your videos or what videos were suggested.
Knowledge comes through comparisons – especially when it comes to performance on YouTube! You can compare different videos, groups, or time periods. To do this, click Compare to… in the upper right corner and choose the measurement you want. View how your channel grows year over year or how your latest videos compare with each other. Analyzing your progress will help you to perform better!
You can also view YouTube statistics and data on your mobile phone – use the YouTube Studio app to do this. Here, you’ll get all the important metrics on their individual tabs:
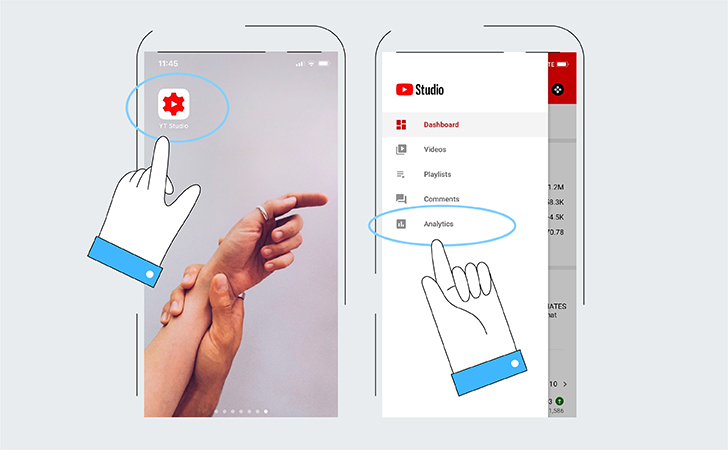
In the app, you can view analytics for the entire channel or for a specific video. The data provided is enough for quick checks and to understand basic trends. Find the app for iPhones here. For those with Android phones, click here.
Now that you know what’s where, let’s go through the most important metrics and see how each of them can be useful for improving your channel.
Each time your content has the opportunity to be viewed is an Impression. This includes thumbnails on the homepage, subscription feed, search, and “up next” section. Roughly speaking, this is the potential reach of your content on YouTube.
Note that notifications and traffic from external websites are not included in impressions data. So if you get more views than impressions, don’t worry. That may mean, for example, that most of your views come from external pages.
The Impressions click-through rate shows the percentage of impressions that turned into views. Each time a user opens your video after seeing the thumbnail drives this metric up.
This data helps you analyze the effectiveness of the titles and thumbnails you use. Based on these figures, you can make more informed decisions while optimizing them.
CTR is often highest right after your video is uploaded. Over time, the rate decreases. This happens because your video is first discovered by your subscribers and other viewers who are most likely to play your content. Afterward, a wider audience sees your thumbnail, and not 100% of them click on it.
This metric will give you the estimated average number of minutes watched per view on a piece of content. So you can see how long users actually watch your videos and make sure they don’t abandon your content five seconds after they clicked on it. This is a key metric that helps you to understand if your viewers like your content.
1,000 views do not necessarily mean 1,000 viewers, and that is what this metric is for. Here you can check how many different people have watched your video. Use this data to compare your audience size to your subscriber base or see videos reached a wider audience.
While there are many more, these five are the most important traffic sources and the easiest to work with.
Retention metrics track HOW people watch your videos and show their engagement level. Analyze the patterns of what grabs viewers’ attention, what keeps it, and what loses it. If you do it right, this tells you everything you need to know to start making better videos and increase the average view duration.
The Audience retention curve shows how many people every moment watched of your video as a percentage of the total number of views. The shape of the graph shows you which parts of your video are the most and the least interesting to viewers:
Here you can also switch to Relative audience retention, which will show how the video is doing compared to other YouTube videos of similar length.
Before we start, it’s important to note that you want to see how the metrics interact with each other. Tracking each of them individually, without taking the others into account is not how to view YouTube Analytics and can lead you to incorrect conclusions. You want to look at how the different analytics work together. That is why you have all the graphs and the ability to add and remove different metrics from them.
When creating your content plan and brainstorming topics for upcoming content, check the top-10 list of videos on your channel. Try to find out what made people like these pieces of content. Look at the most reviewed parts of these videos – maybe you need to make a more detailed video on a particular point you made in that part. Read the comments. Learn more about who your viewers are and how they found your content (Audience and Reach tabs). Keep all that data in mind when making the next videos. You don’t want to start your video with “Heyyy cuties” if your most active viewers are people over 35.
The click-through rate is quite an important metric in that it shows whether your titles and thumbnails work well. But don’t overdo it when trying to increase CTR. The YouTube algorithm is smart enough to identify clickbaits and videos that don’t meet viewers’ expectations.
Here’s how. What happens when you find out that the creator of the video used clickbait in the title? You close it right away and find something more interesting. The video gets high CTR, but a very low average view duration. Content with such performance is less likely to get recommended by YouTube to users. If your title is okay, but your CTR is still too high and the view duration low, look for other reasons. It may be the quality of the image or the sound, or something you said at the beginning of the video that your viewers didn’t like, or even a new type of intro.
On the other hand, you shouldn’t get too worried about CTR being high right after you’ve posted a video. First, your content gets to your subscribers and constant viewers who are most likely to click on it. As the video is being exposed to a wider audience, the CTR will decrease. Give it some time, and then draw your conclusions.
If you have a low CTR and high average view duration, this may mean that your content isn’t getting viewers to click, so you need to work on titles and thumbnails. Make them catchy (again, no clickbait).
To craft a title that will hook viewers’ attention, first you need to use it to accurately pitch the value of your content. When you’re posting, say, a video featuring DIY room decoration ideas, mention “DIY” and “room decor” in the title. This way, people who are looking specifically for that kind of content will immediately know that your video is what they want.
Aside from accuracy, you want to add some creativity to your titles and thumbnails. And the best advice here is to learn from other people whose success depends on presenting their own content. Find inspiration on popular bloggers’ channels and in reputable magazines and newspapers.
Knowing where your views come from helps you to make more informed decisions on your content optimization, titling, presentation, and strategy in general.
YouTube Search, for example, will give you a very high CTR. When you see that people don’t find your content through search, you know that you need to work on optimization. Checking this traffic source in Advanced mode gives you some insights into your keywords usage. See where successful and which turned out to be duds.
While Search gives you the best CTR, the Suggestions section will provide you with a more engaged audience and longer views. YouTube WANTS people to stay for as long as possible on the platform. Therefore the algorithm personalizes this feed for every user and finds the most interesting videos for them. When you see that your videos are not being suggested, that may mean that you need to work harder on your audience targeting strategy and/or make more engaging videos.
Check the retention graph to see when and why people bounce from your content to someone else’s. Try new ways to introduce yourself in your video: according to YouTube, the first 15 seconds is when people are most likely to lose interest. Learn more about your viewers. Adjust your tone and make the content even more interesting for your audience.
There’s not too much information on your viewers in the YouTube Analytics; you’ll see a breakdown by gender, age group, and country they’re based in. Also, you can check if your audience is using subtitles and what languages are the most popular on your channel. Let’s see how can that help you.
Let’s say you’re a US-based beauty blogger who makes fun tutorials on how to use cheap cosmetics. Before checking the analytics, you likely expect that the core of your audience consists of teenagers and young women in the US. But then you discover that your videos reach thousands of people outside the US, and that audience is more engaged than you thought it might be. Now, knowing that, you can make better content for that newly discovered audience. For example, add subtitles and explore beauty products from other countries. Or you may want to pivot your strategy and tone to win back the core audience.
Even the time when you upload your videos can affect the final number of views. In the real-time section (Overview tab) click on details and you’ll see bars that represent the number of channel views each hour. Using this data, you can choose the best time to upload your videos and gain views quickly.
Don’t get too upset if there are not too many likes and don’t worry about dislikes either. They won’t decrease your views. On the contrary, they might even increase them. The thing that really affects your growth is the time viewers spend watching your videos. On the other hand, likes and dislikes have the value in that they show you your audience’s preferences, which is also very useful.
Ready to take your videos to the next level? Download Movavi Video Suite, an all-in-one editing app that will help you make videos of all kinds! Use our special promocode SUPERBLOG to get 10% off – or simply click on one of the buttons below to get your discount!